Turn on key-based colors
Enable key-based colors so W&B can assign run colors based on a metric or configuration key instead of the default per-run colors.- Navigate to your W&B project.
- Select the Workspace tab from the project sidebar.
- Click the Settings icon in the top right corner.
- From the drawer, select Runs.
- In the Run colors section, select Key-based colors.
- Configure the following options:
- From the Key dropdown, select the metric or config value you want to use for assigning colors to runs.
- From the Y value dropdown, select the Y value you want to use for assigning colors to runs.
- Set the number of buckets to a value from 2 to 8.
When you use key-based colors, the option to customize run colors isn’t available.
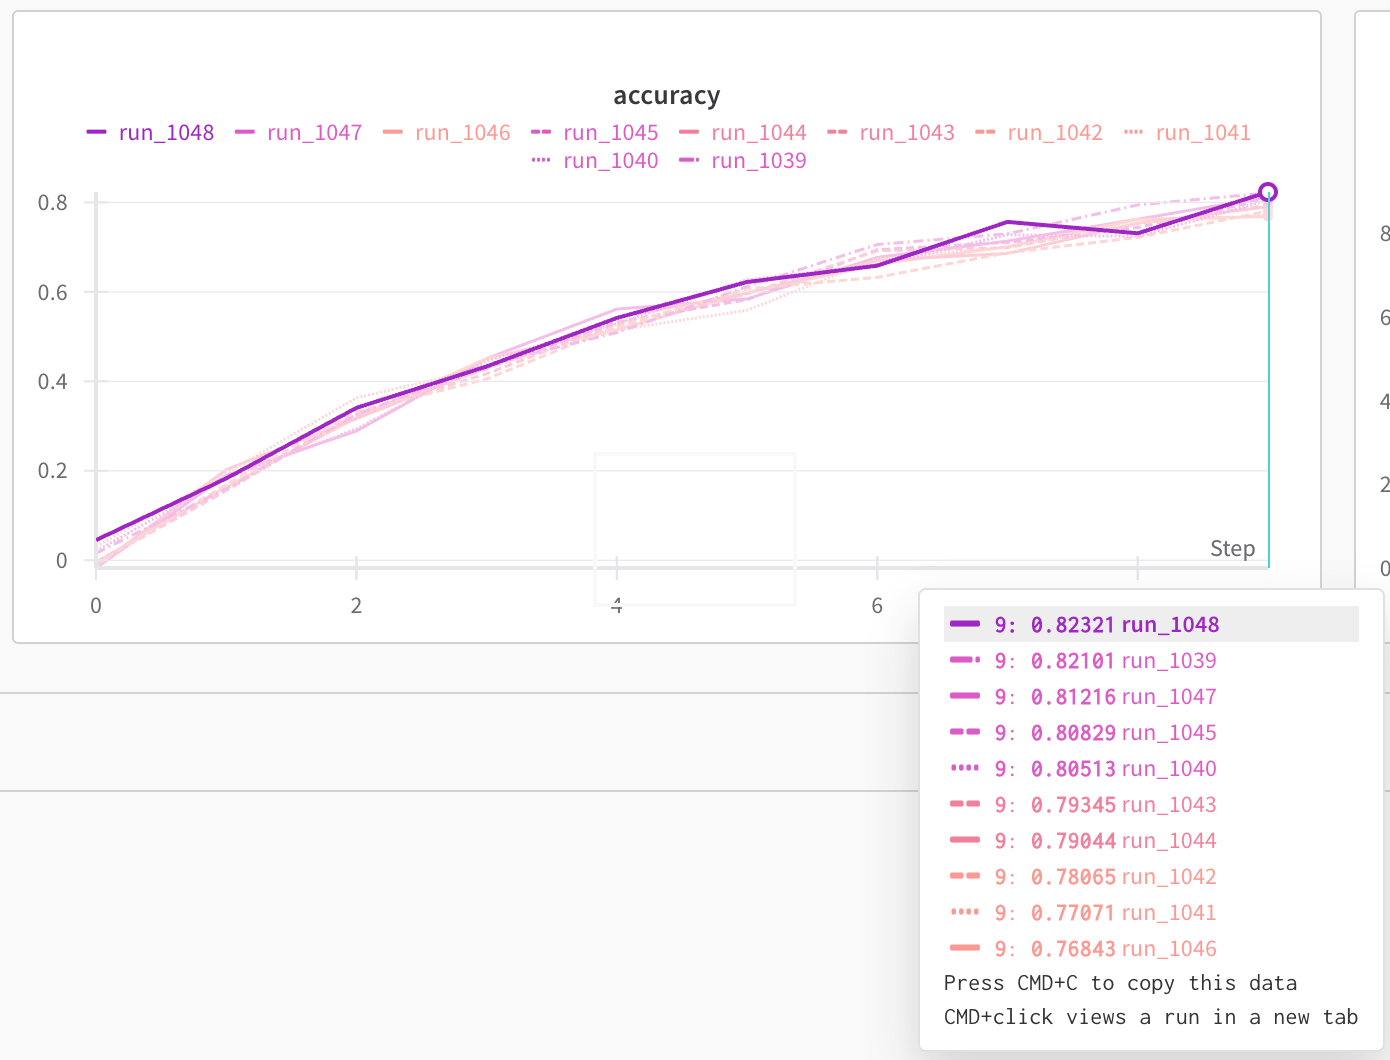
Example: key-based colors with a loss metric
In this example plot, W&B colors runs with a gradient where darker colors represent higher loss values and lighter colors represent lower loss values. The Y value is set to Latest to use the most recent loss value for each run.Set a metric
Choose a metric to base your run colors on. The metric options in your Key dropdown come from the custom metrics you log to W&B and the default metrics that W&B defines.Default metrics
Relative Time (Process): The relative time of the run, measured in seconds since the start of the run.Relative Time (Wall): The relative time of the run, measured in seconds since the start of the run, adjusted for wall clock time.Wall Time: The wall clock time of the run, measured in seconds since the epoch.Step: The step number of the run, which is typically used to track the progress of training or evaluation.
Custom metrics
Color runs and create meaningful plot legends based on custom metrics that your training or evaluation scripts log. You log custom metrics as key-value pairs, where the key is the name of the metric and the value is the metric value. For example, the following code snippet logs accuracy ("acc" key) and loss ("loss" key) during a training loop:
"acc" and "loss" are available options.
Set a configuration key
Color runs based on a configuration key such as a hyperparameter. The configuration options in your Key dropdown come from the key-value pairs you pass to theconfig parameter when you initialize a W&B run. Use configuration keys to log hyperparameters or other settings used in your training or evaluation scripts.
"learning_rate", "batch_size", and "optimizer" are available options.
Set a Y value
After you select a key, set a Y value to control which value of the selected metric or config value drives the color assignment. The Y value determines which value W&B uses to assign a color to each run. You can choose from the following options:- Latest: Determines color based on Y value at the last logged step for each line.
- Max: Determines color based on the highest Y value logged against the metric.
- Min: Determines color based on the lowest Y value logged against the metric.
Customize buckets
Adjust the number of buckets to control how finely W&B groups your runs by value. Buckets are ranges of values that W&B uses to categorize runs based on the metric or configuration key you select. W&B distributes buckets evenly across the range of values for the specified metric or configuration key and assigns each bucket a unique color. W&B displays runs that fall within a bucket’s range in that color. Consider the following example: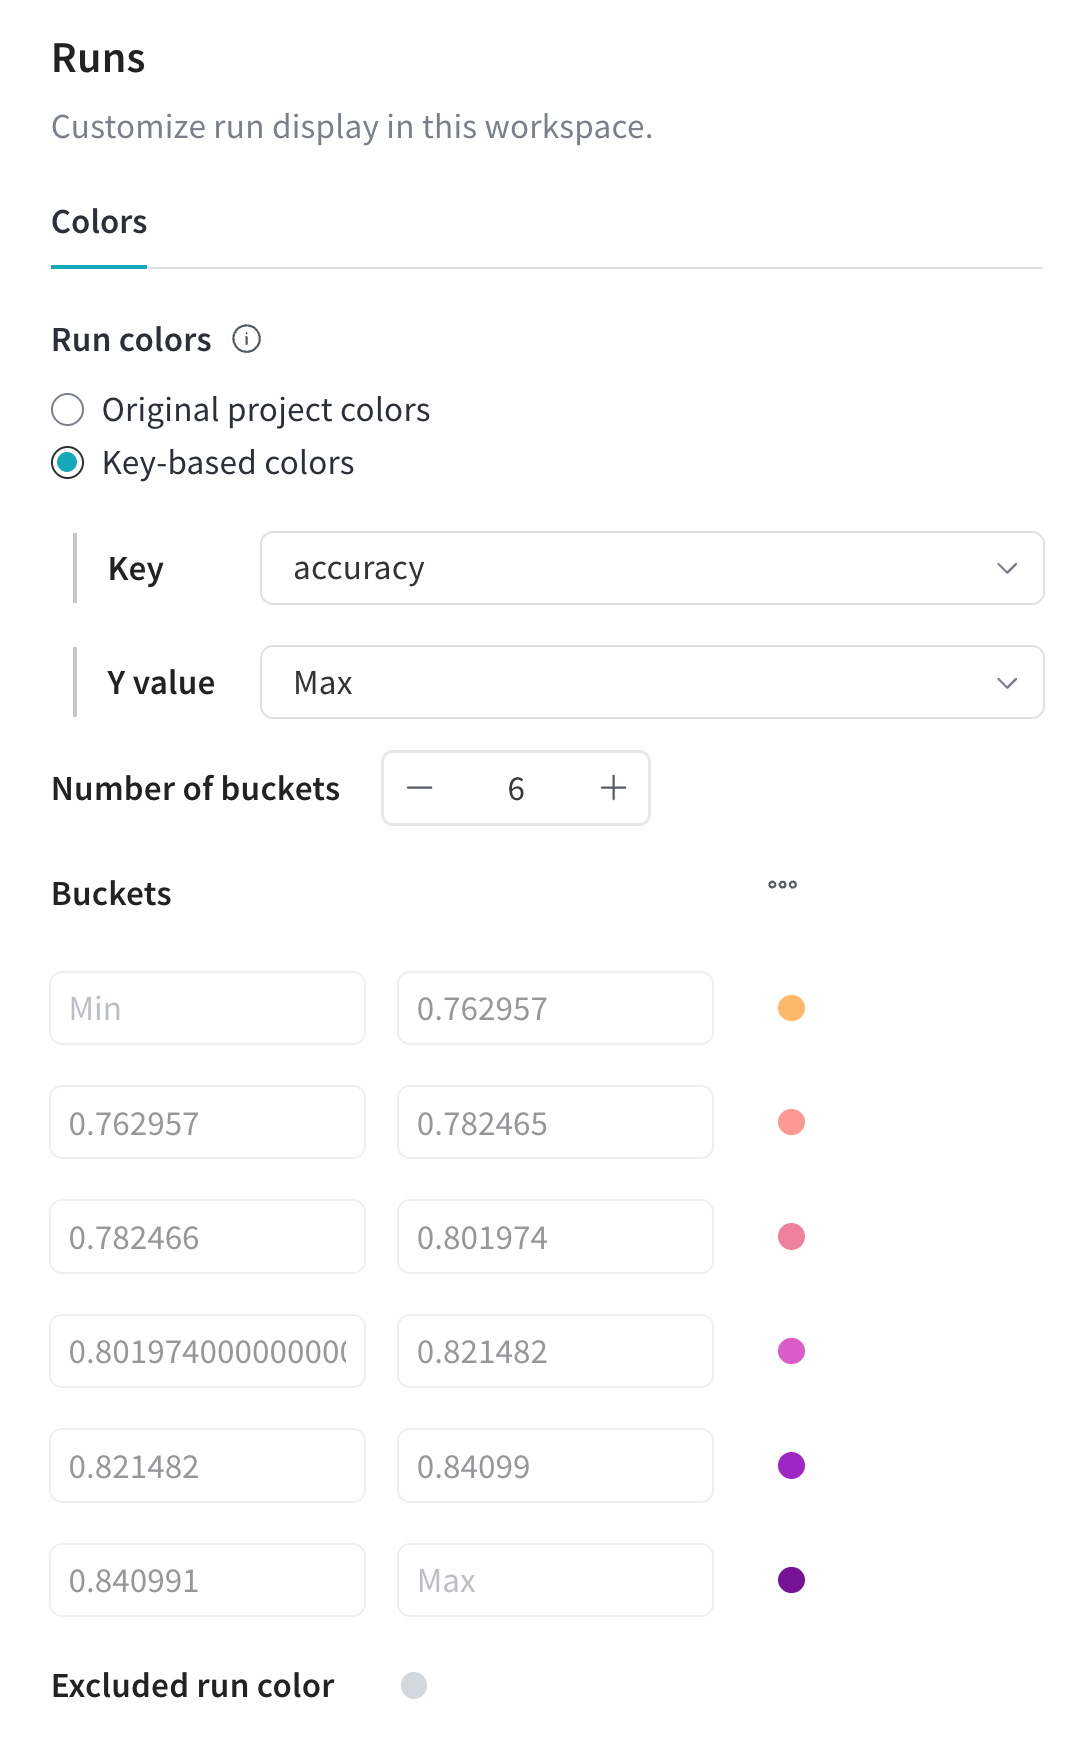
- Key is set to
"Accuracy"(abbreviated as"acc"). - Y value is set to Max.
- Bucket 1: (Min to 0.7629)
- Bucket 2: (0.7629 to 0.7824)
- Bucket 3: (0.7824 to 0.8019)
- Bucket 4: (0.8019 to 0.8214)
- Bucket 5: (0.8214 to 0.8409)
- Bucket 6: (0.8409 to Max)